Monitoring!
One Paragraph Explainer
At the very basic level, monitoring means you can easily identify when bad things happen at production. For example, by getting notified by email or Slack. The challenge is to choose the right set of tools that will satisfy your requirements without breaking your bank. May I suggest, start with defining the core set of metrics that must be watched to ensure a healthy state – CPU, server RAM, Node process RAM (less than 1.4GB), the number of errors in the last minute, number of process restarts, average response time. Then go over some advanced features you might fancy and add to your wish list. Some examples of a luxury monitoring feature: DB profiling, cross-service measuring (i.e. measure business transaction), front-end integration, expose raw data to custom BI clients, Slack notifications and many others.
Achieving the advanced features demands lengthy setup or buying a commercial product such as Datadog, NewRelic and alike. Unfortunately, achieving even the basics is not a walk in the park as some metrics are hardware-related (CPU) and others live within the node process (internal errors) thus all the straightforward tools require some additional setup. For example, cloud vendor monitoring solutions (e.g. AWS CloudWatch, Google StackDriver) will tell you immediately about the hardware metrics but not about the internal app behavior. On the other end, Log-based solutions such as ElasticSearch lack the hardware view by default. The solution is to augment your choice with missing metrics, for example, a popular choice is sending application logs to Elastic stack and configure some additional agent (e.g. Beat) to share hardware-related information to get the full picture.
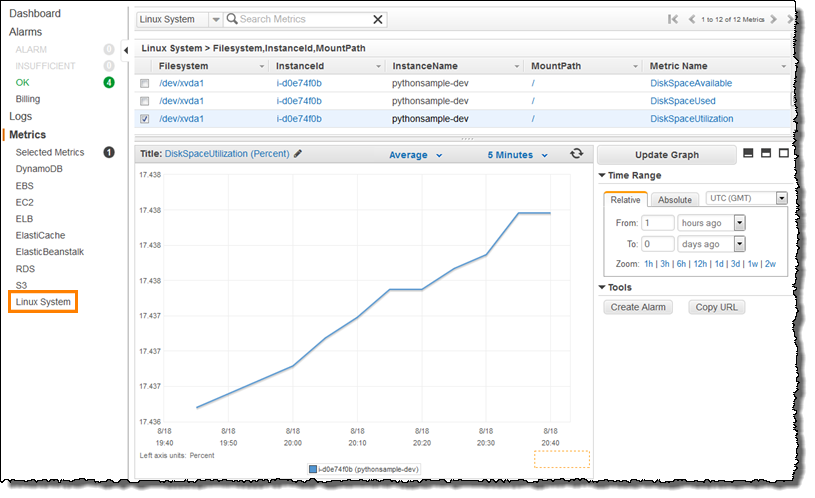
Monitoring example: AWS cloudwatch default dashboard. Hard to extract in-app metrics

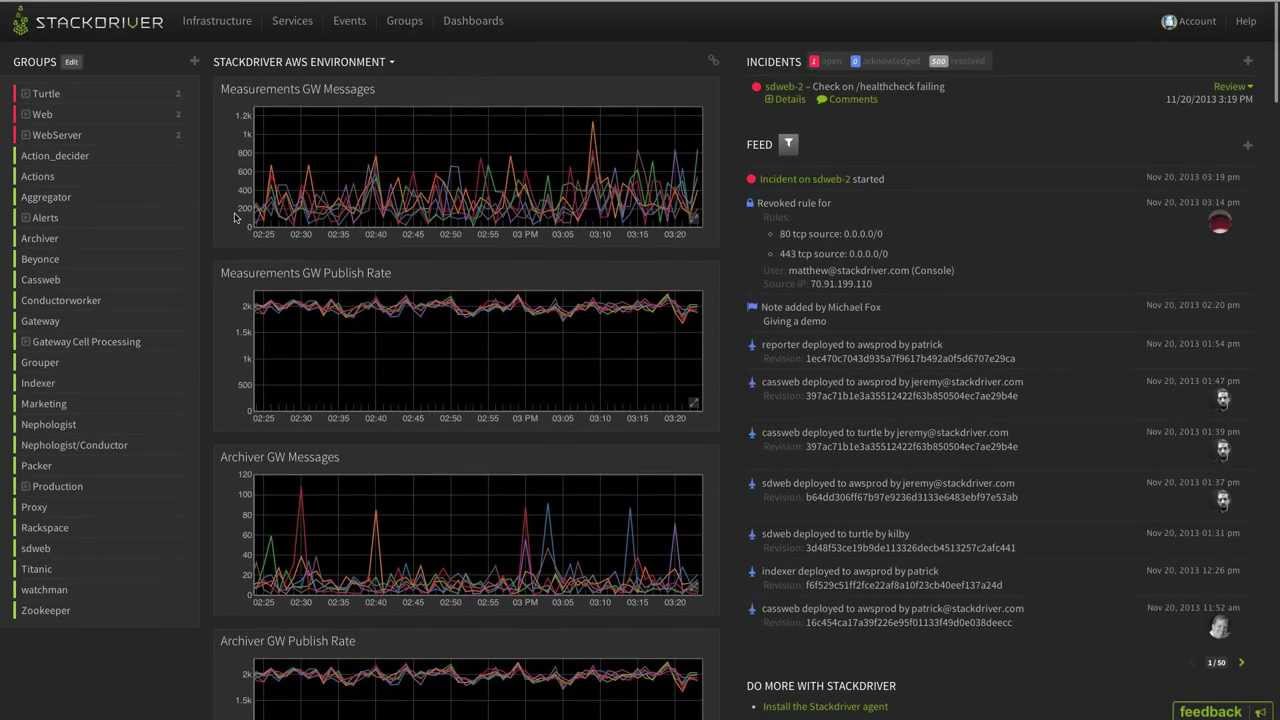
Monitoring example: StackDriver default dashboard. Hard to extract in-app metrics

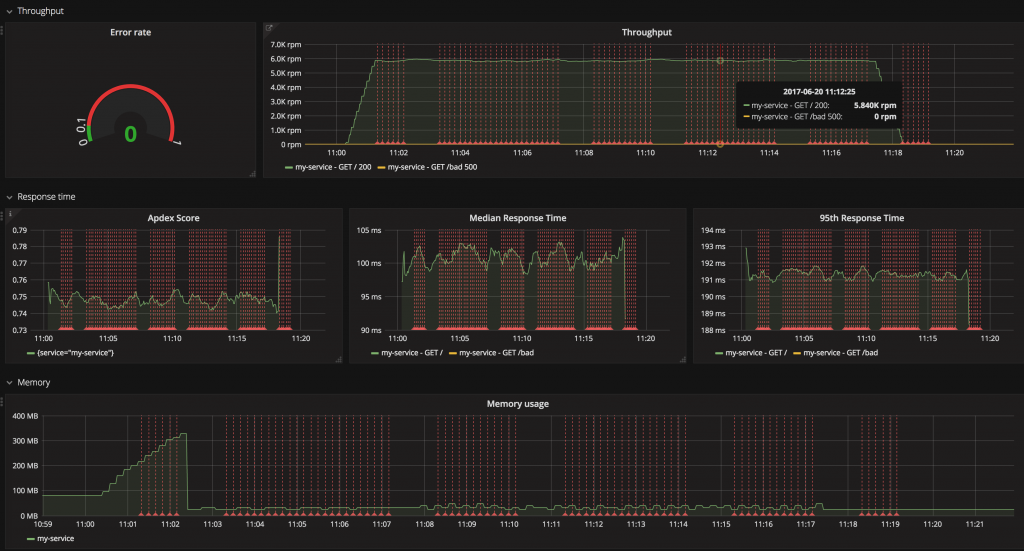
Monitoring example: Grafana as the UI layer that visualizes raw data

What Other Bloggers Say
From the blog Rising Stack:
…We recommend you to watch these signals for all of your services: Error Rate: Because errors are user facing and immediately affect your customers. Response time: Because the latency directly affects your customers and business. Throughput: The traffic helps you to understand the context of increased error rates and the latency too. Saturation: It tells how “full” your service is. If the CPU usage is 90%, can your system handle more traffic? …