Make your app transparent using smart logs
One Paragraph Explainer
Since you print out log statements anyway and you're obviously in a need of some interface that wraps up production information where you can trace errors and core metrics (e.g. how many errors happen every hour and which is your slowest API end-point) why not invest some moderate effort in a robust logging framework that will tick all boxes? Achieving that requires a thoughtful decision on three steps:
1. smart logging – at the bare minimum you need to use a reputable logging library like Winston, Bunyan and write meaningful information at each transaction start and end. Consider to also format log statements as JSON and provide all the contextual properties (e.g. user id, operation type, etc) so that the operations team can act on those fields. Include also a unique transaction ID at each log line, for more information refer to the bullet below “Write transaction-id to log”. One last point to consider is also including an agent that logs the system resource like memory and CPU like Elastic Beat.
2. smart aggregation – once you have comprehensive information on your servers file system, it’s time to periodically push these to a system that aggregates, facilities and visualizes this data. The Elastic stack, for example, is a popular and free choice that offers all the components to aggregate and visualize data. Many commercial products provide similar functionality only they greatly cut down the setup time and require no hosting.
3. smart visualization – now the information is aggregated and searchable, one can be satisfied only with the power of easily searching the logs but this can go much further without coding or spending much effort. We can now show important operational metrics like error rate, average CPU throughout the day, how many new users opted-in in the last hour and any other metric that helps to govern and improve our app
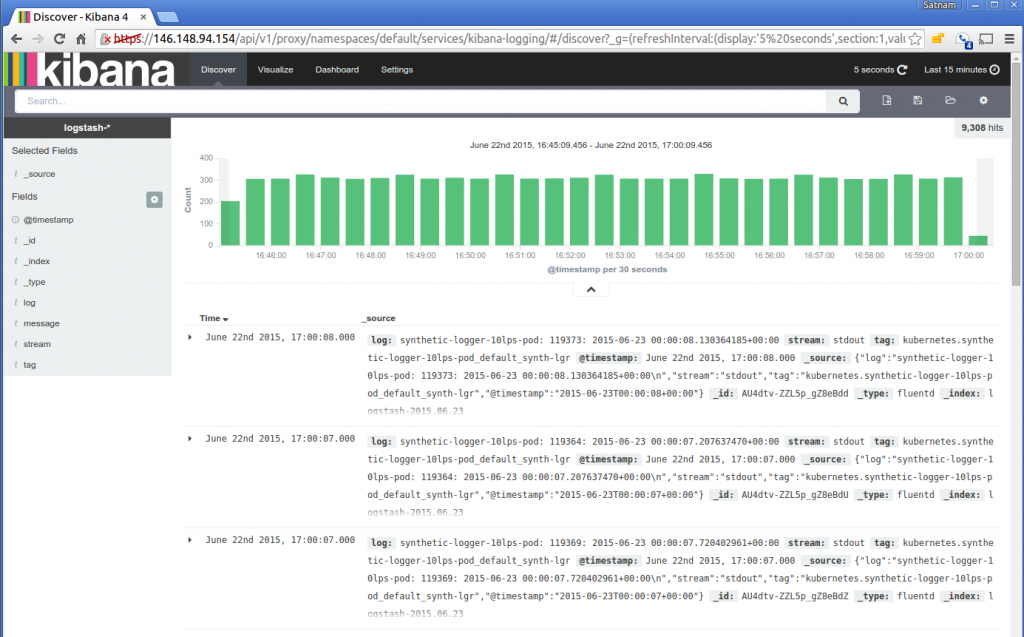
Visualization Example: Kibana (part of the Elastic stack) facilitates advanced searching on log content

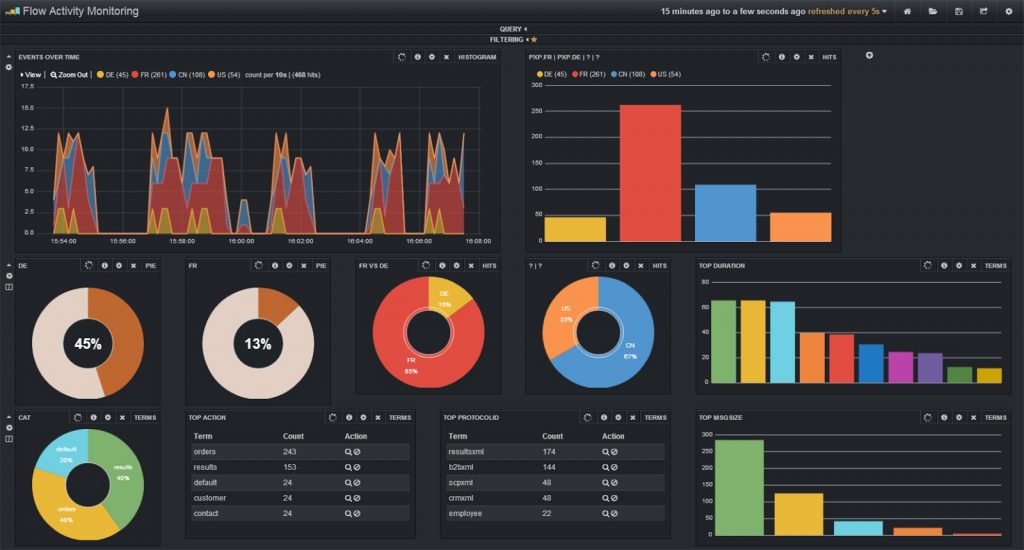
Visualization Example: Kibana (part of the Elastic stack) visualizes data based on logs

Blog Quote: Logger Requirements
From the blog Strong Loop:
Lets identify a few requirements (for a logger):
- Timestamp each log line. This one is pretty self-explanatory – you should be able to tell when each log entry occurred.
- Logging format should be easily digestible by humans as well as machines.
- Allows for multiple configurable destination streams. For example, you might be writing trace logs to one file but when an error is encountered, write to the same file, then into error file and send an email at the same time…